
Figure 4.
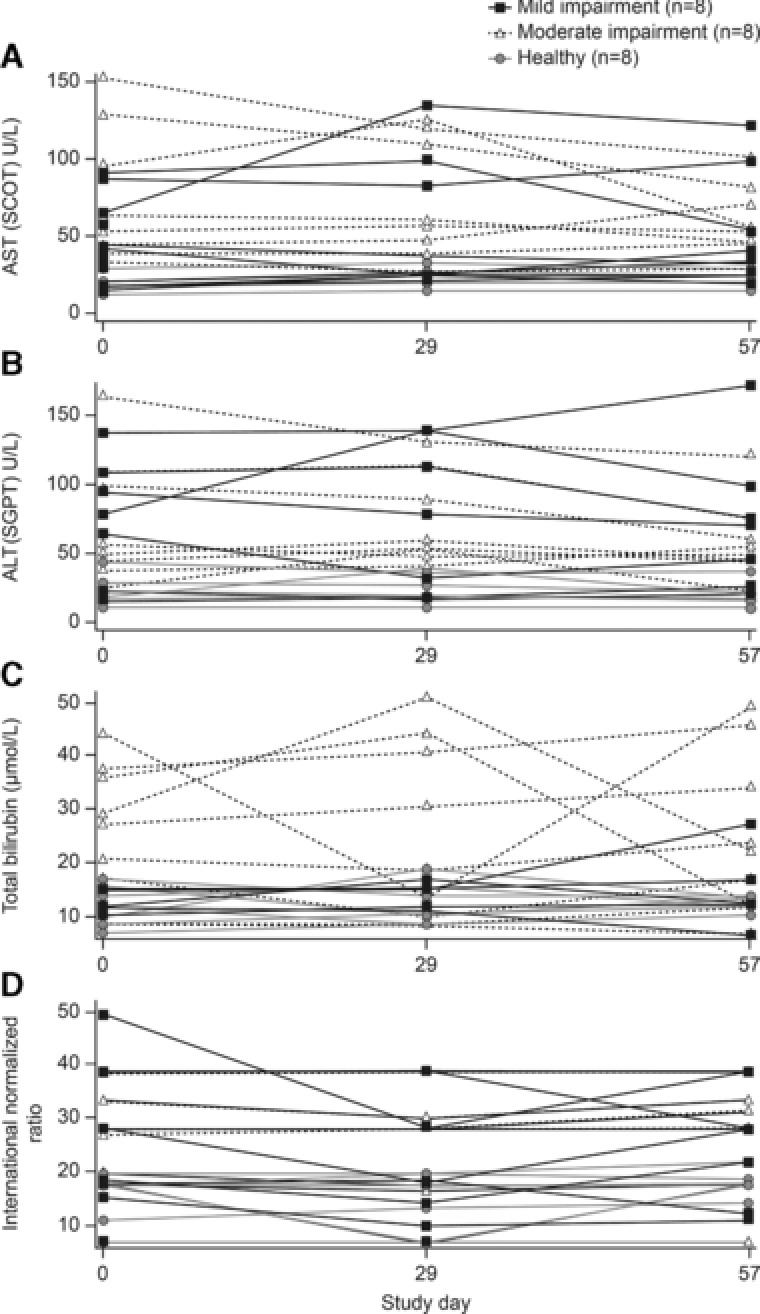
Plots of individual values for (a) aspartate aminotransferase (AST), (b) alanine aminotransferase (ALT), (c) total bilirubin, and (d) international normalized ratio at baseline and on days 29 and 57.
Official websites use .gov
A
.gov website belongs to an official
government organization in the United States.
Secure .gov websites use HTTPS
A lock (
) or https:// means you've safely
connected to the .gov website. Share sensitive
information only on official, secure websites.
Plots of individual values for (a) aspartate aminotransferase (AST), (b) alanine aminotransferase (ALT), (c) total bilirubin, and (d) international normalized ratio at baseline and on days 29 and 57.