
Figure 1. Responses to isolated arm heating and cooling.
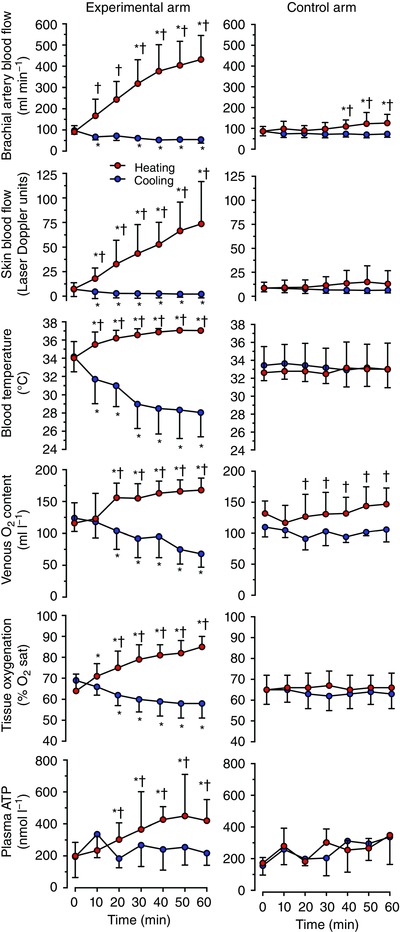
Brachial artery blood flow, forearm skin blood flow, forearm venous blood temperature, venous oxygen content, near‐infrared spectroscopy‐derived tissue oxygenation (expressed as percentage O2 saturation; % O2 sat) and plasma [ATP] during isolated arm heating or cooling compared with the control arm in healthy individuals resting in the supine position in a thermoneutral environment. Data are shown as means ± SD for 6–10 subjects. *Significantly different from initial 0 min, P < 0.05. †Significantly different from cooled experimental arm.