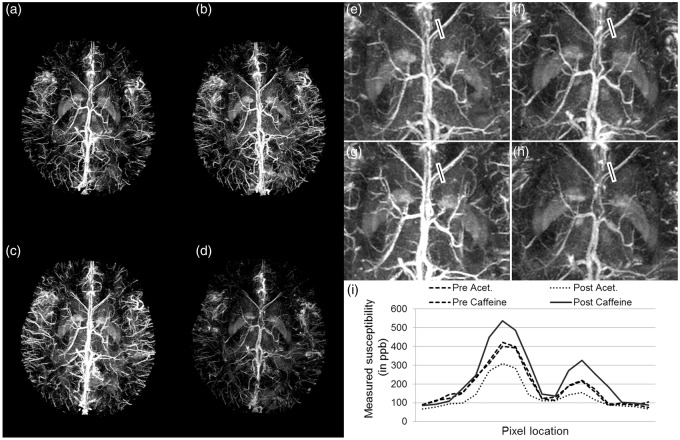
Figure 2.
Evaluation of dynamic changes in venous susceptibility distribution due to the administration of caffeine and acetazolamide. Phase data were acquired 4 times after the drug ingestion/infusion, at an interval of 15 min. Maximum intensity projection (MIP) of susceptibility maps for the data acquired before (a) caffeine and (b) acetazolamide intake, respectively, (c) MIP of susceptibility maps for the data at the second time point (30 min) after caffeine intake, (d) MIP of susceptibility maps at the second time point (30 min) after acetazolamide intake. MIP images were generated from susceptibility maps over 32 slices or 16 mm in the slice-select direction. (e) to (h) represent zoomed insets of images (a) to (d), respectively. The profile plot (i) demonstrates the variation in susceptibility values across the septal veins, along the black lines shown in (e) to (h), caused by these altered brain states.

