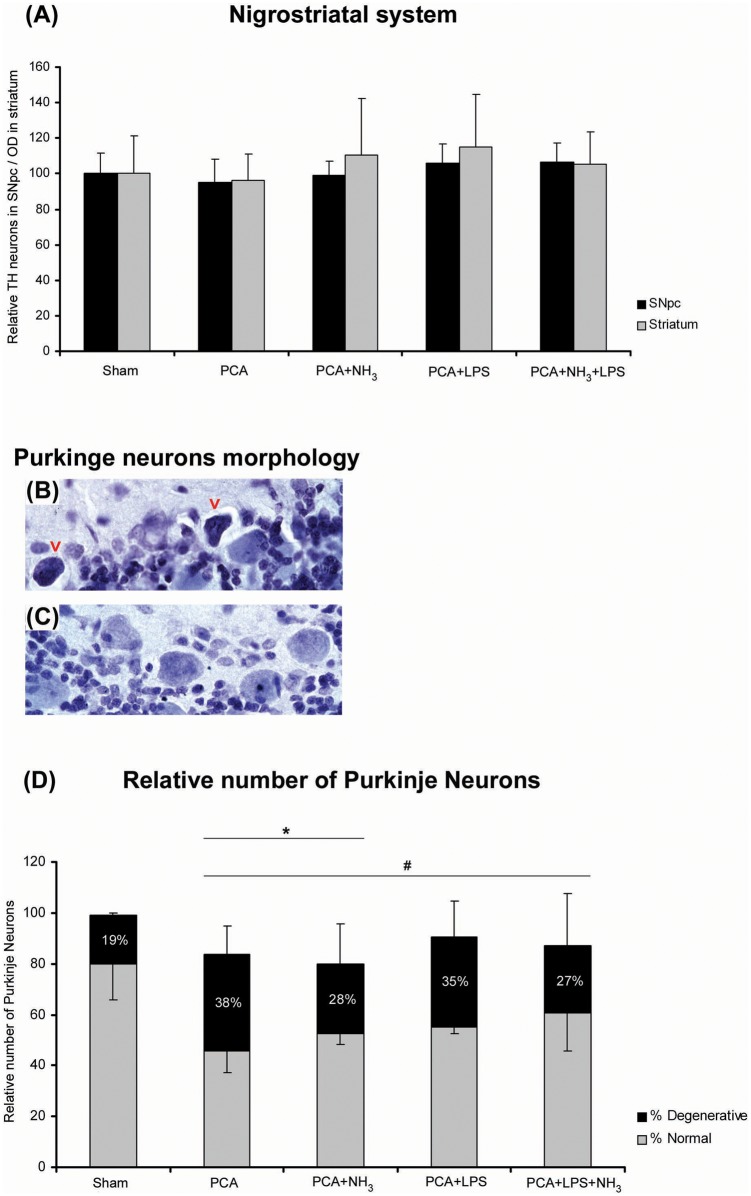
Figure 1.
Stereological analysis of dopaminergic neurons in SNpc and Purkinje neurons in cerebellum. (a) Relative number of dopaminergic neurons in SNpc (black bar) and the optical density of dopaminergic prolongations in striatum (grey bar). (b) Representative image of normal Purkinje neurons in PCA+NH3. (c) Representative image of Purkinje neurons with degenerative features (red arrows) in PCA+NH3. (d) Bar diagram represents the relative number of Purkinje neurons. Gray bar correspond to normal Purkinje neurons and black bar to degenerative cells (expressed in relation to the total number of Purkinje cells). *P ≤ 0.05 total number of Purkinje cells compared to sham. #P ≤ 0.05 normal Purkinje neurons compared to sham.
PCA: portocaval anastomosis; LPS: lipopolysaccharide; SNpc: substantia nigra pars compacta; TH: tyrosine hydroxylase.

