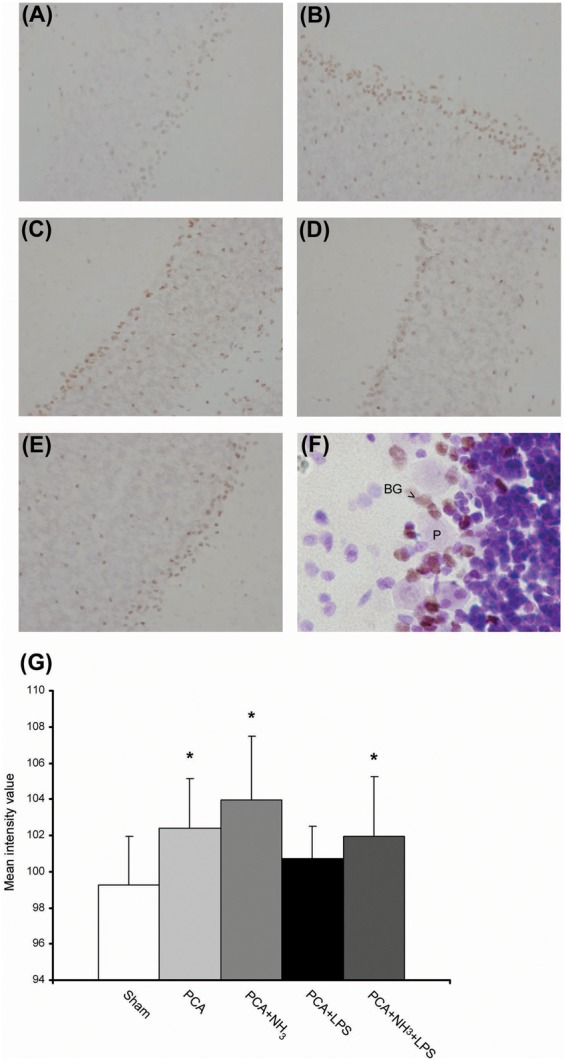
Figure 2.

Bergmann glia apoptosis (a–g) representative images of cleaved-caspase-3 immunolabeling. Objective 20×. (a) Sham. (b) PCA. (c) PCA+NH3. (d) PCA+LPS. (e) PCA+NH3+LPS. (f) Representative image of cleaved-caspase-3 immunolabeling and Nissl counterstain, the double stain reveals cell death of Bergmann glia (BG; arrow) in Purkinje cell layer (P). Objective 60×. (g) Bar diagram represents mean intensity value of caspase-3 inmunostaining. *P ≤ 0.05 compared to sham.
PCA: portacaval anastomosis; LPS: lipopolysaccharide.
