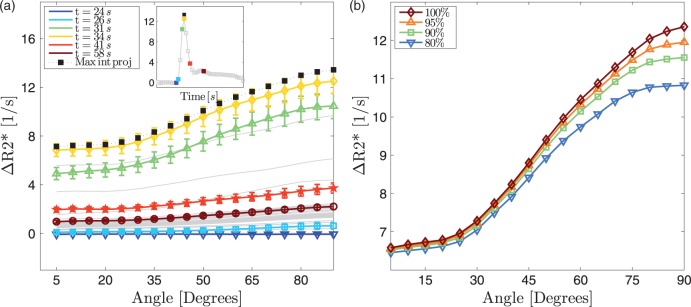
Figure 3.
(a) Changes in as a function of time (average of 13 subjects) relative to the average signal of the first five scans of the time series. Before averaging, the time courses of individual subjects were shifted so that the maxima coincide for all subjects. The inset shows the change in averaged over all voxels between 85 ° and 90 °. When the CA reaches its maximum (yellow square in the inset and yellow line in the main plot), the angle dependency also reaches its maximum. There are both an angle independent offset and an angle-dependent component to these plots. The black squares represent of a maximum intensity projection along the time axis. This means that for each voxel the maximum CA concentration is captured, which removes regional differences in CA arrival time. Therefore, the black line is located slightly above the yellow line. The bars represent standard errors. The colours in the inset correspond to the colours of the main plot. (b) The angle dependency in changes when voxels with high CBV values are removed. However, even when the top 20% voxels are removed the angle dependency remains high.

