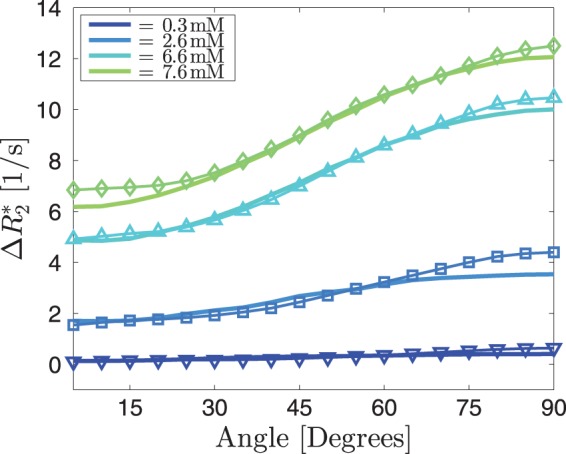
Figure 6.

The thin lines represent the average angle dependencies across 13 subjects for four different CA concentrations. The thick lines are the best fits, resulting in a background blood vessel volume fraction of 1.0% and an anisotropic blood vessel volume fraction of 1.0%. The resulting CA concentrations are 0.3, 2.6, 6.6 and 7.6 mM. The anisotropic part was simulated assuming four parallel vessels of equal radius.
