Figure 2.
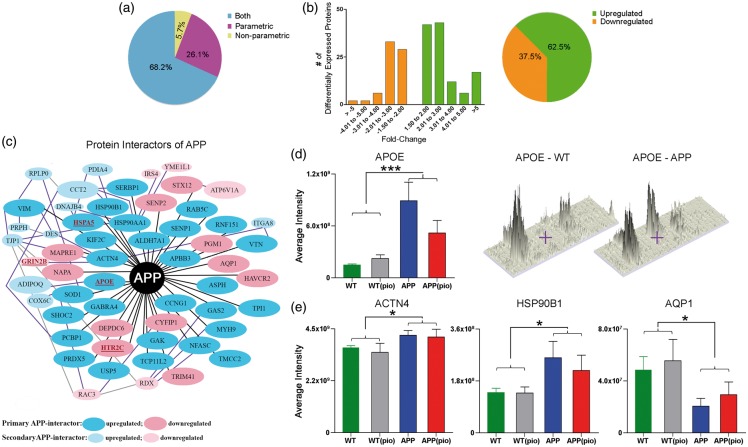
Proteins differentially expressed in brain vessels of APP mice. (a) Distribution (in percentage) of proteins identified with either parametric or non-parametric Student t-test or both statistical analyses. (b) Fold-change distribution of differentially expressed proteins along with the percentage of upregulated or downregulated proteins in the APP vasculature. (c) Protein interactors of APP or proteins known to directly (black line) or indirectly (secondary: purple line and tertiary: grey line interactions only) interact with APP were identified using the STRING, IntAct, and in-house, and/or PubMed reference library. Note that only a few indirectly interacting proteins have been shown. Proteins associated with increased AD risk in the AlzGene database and/or by querying the PubMed reference library are identified in red and underlined (e.g. APOE). Average (d) APOE, and (e) HSP90B1, AQP1, and ACTN4 peptide/s intensities for WT (green), WT(pio) (grey), APP(blue), and APP(pio) (red). Error bars denote standard error or SEM, ⋆ p < 0.05 and ⋆⋆⋆ p < 0.001 denote significant genotype effect using two-way ANOVA. PIO: pioglitazone.

