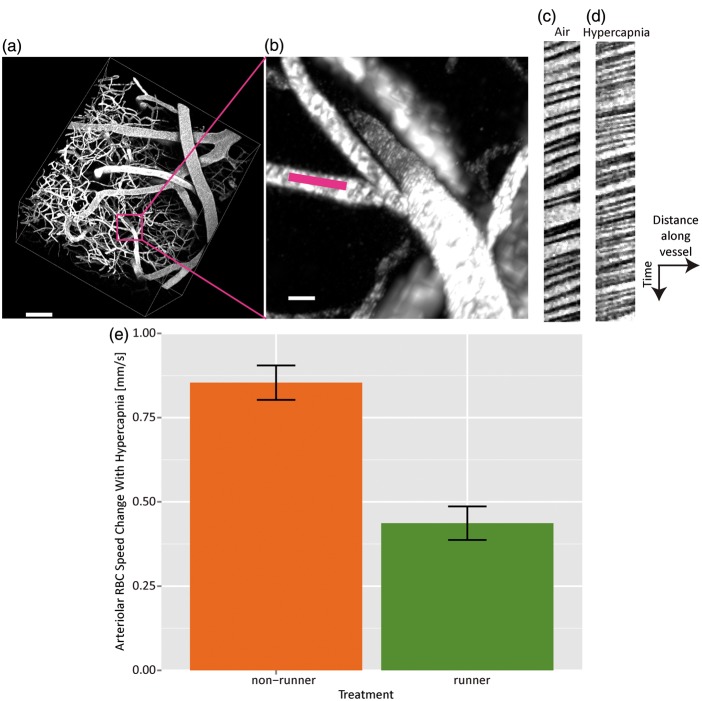
Figure 5.
RBC speeds are measured in a penetrating vessel branch of an artery (a, scale 80 µm, and b, scale 10 µm, with pink line showing location of line scan). Line scan data samples from this vessel during air (c) and hypercapnia (d). RBC speeds thus estimated in this vessel were 1.32 ± 0.02 mm/s during air breathing and 1.86 ± 0.03 mm/s during breathing of 10% CO2. Steeper slopes indicate smaller RBC speeds. Bar graph (e) showing change in arteriolar RBC speed induced by hypercapnia for nonrunners (N = 5) and runners (N = 4).

