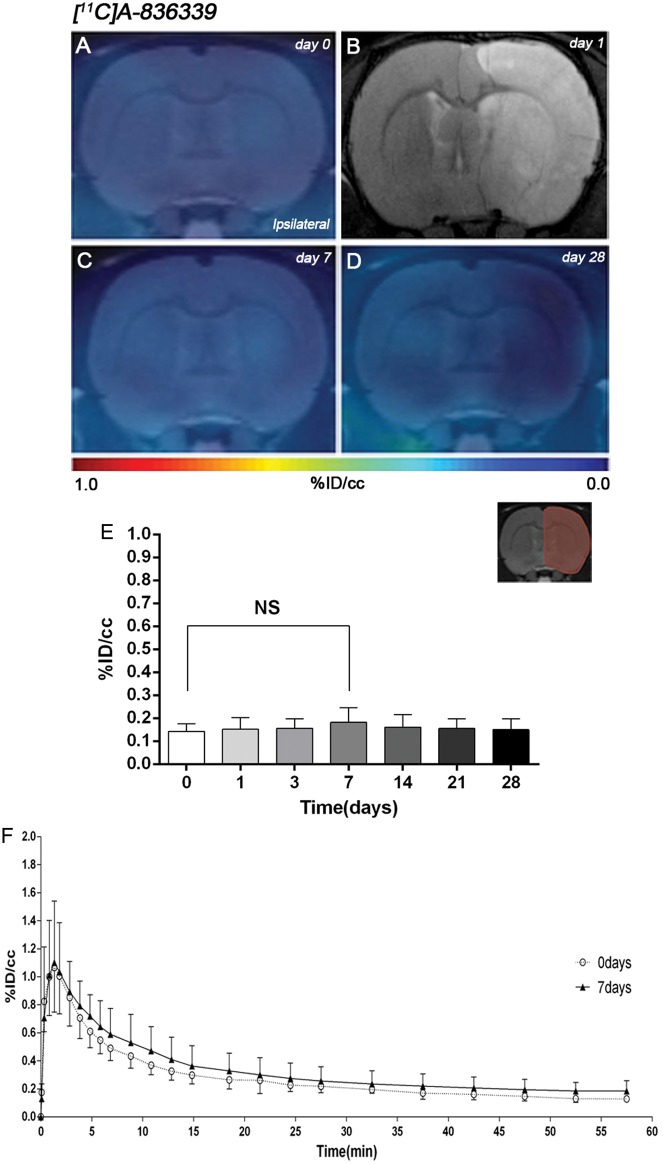
Figure 1.
Time course of the progression of [11C]A-836339 signal before and after middle cerebral artery occlusion (MCAO). The brain lesion at day 1 after reperfusion is shown with magnetic resonance imaging (MRI) alterations in T2-weighted (T2W) signal (b). Serial CB2 receptors PET binding images of coronal planes at control (day 0) (a), day 7 (c) and day 28 (d) after reperfusion. PET images are co-registered with a MRI (T2W) template to localize the PET signal. Images are generated by averaging all PET frames and correspond to the lesion evolution of the same animal over time. (e) %ID/cc (mean ± SD) of [11C]A-836339 was quantified in the entire ipsilateral cerebral hemisphere. The upper right panel shows the selected brain ROI for the quantification defined on a slice of a MRI (T2W) template. Rats (n = 6) were repeatedly examined by PET before (day 0) and at 1, 3, 7, 14, 21 and 28 after ischemia. (f) Time activity curves of [11C]A-836339 binding in the ipsilateral hemisphere at days 0 and 7 following cerebral ischemia.

