
Figure 5.
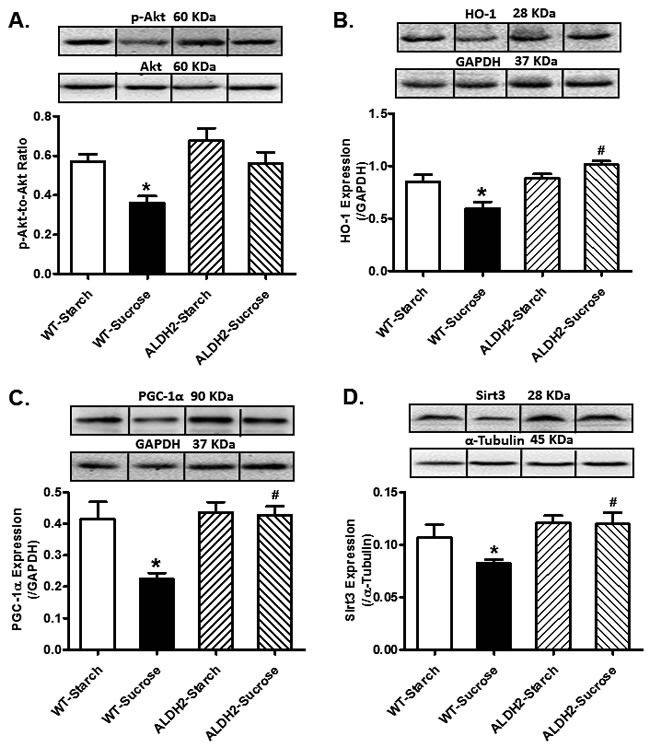
Effect of 8 weeks of sucrose diet (starch as control diet) intake on (A) phosphorylated levels of Akt; (B) protein level of HO-1, (C) protein level of PGC-1α; and (D) protein level of Sirt3 in WT and ALDH2 mice. Insets: Representative gel blots depicting expression of pan and phosphorylated Akt, HO-1, PGC-1α and Sirt3 using specific antibodies. GAPDH or α-tubulin was used as loading control; Mean ± SEM, n = 5 - 6 mice per group; *p < 0.05 vs. WT-Starch group, # p < 0.05 vs. WT-Sucrose group.