
Figure 6. The best ranked pose of CS-6 in the ATP binding site of Hsp90 generated with docking.
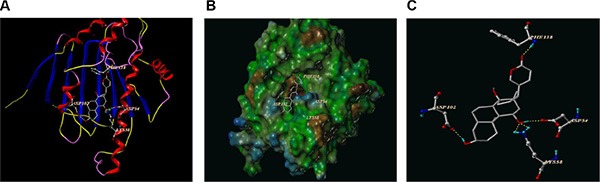
(A) Interactions of CS-6 and Hsp90 are delineated by ribbon structure, Hydrogen bonds are displayed as yellow dashed lines, and the participating amino acid residues are marked. (B) MOLCAD representation the molecular lipophilic potential surface upon the bioactive pose of CS-6 in the ATP binding site of Hsp90. The blue denotes the hydrophilic, brown for the lipophilic and green corresponds to the neutral moiety. (C) The interaction between the residues of Hsp90 and CS-6 were displayed directly without the whole protein in cartoon.