
Figure 1. PD-L1 expression across pituitary adenomas.
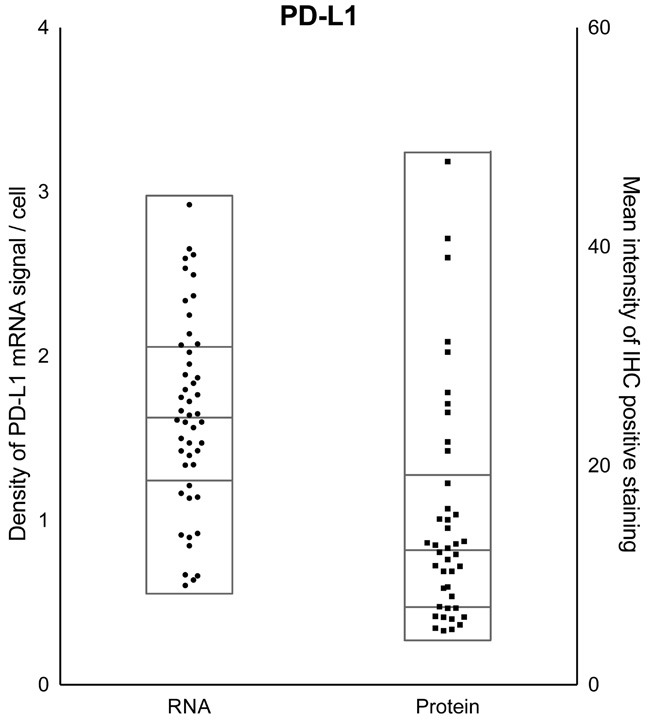
Quantification of PD-L1 mRNA (left y-axis) and protein (right y-axis) levels across all pituitary tumors in the cohort reveals diversity in expression. Samples within each scatter plot are divided into quartiles, centered around the median.