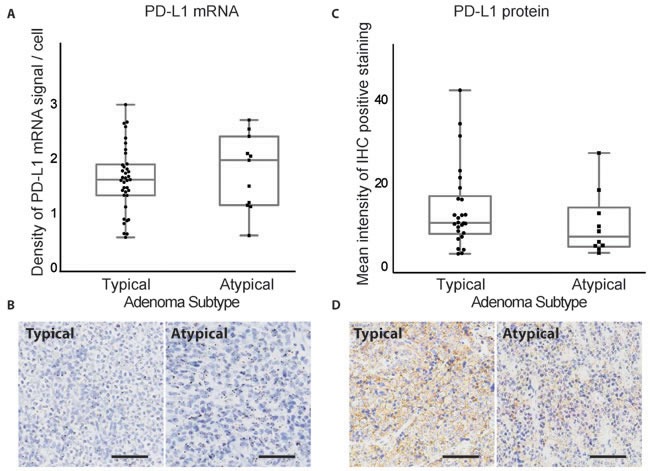
Figure 4. PD-L1 mRNA and protein expression in typical and atypical pituitary tumors.

A. Quantification of PD-L1 RNAscope staining in typical (n = 37) and atypical (n = 11) pituitary adenomas. B. RNAscope staining of PD-L1 mRNA in a typical and an atypical pituitary tumor. C. Quantification of PD-L1 IHC staining in typical and atypical pituitary adenomas. D. IHC staining of PD-L1 protein in a typical and an atypical pituitary tumor. Scale bar 50μm.
