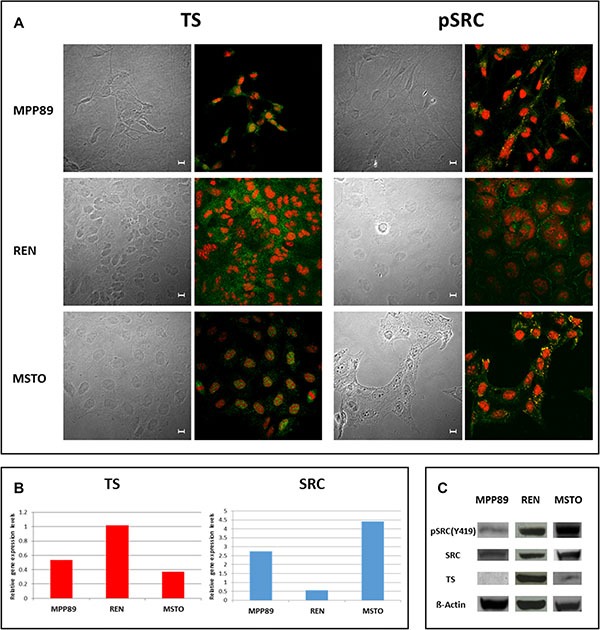
Figure 1. Basal TS, pSRC and SRC localization and expression in MPM cells.

In all MPM cell lines analyzed, the subcellular distribution of both TS and pSRC was detected by confocal microscopy after immunostaining with anti-TS (FITC-green, left panel) and anti-pSRC (FITC-green, right panel). Propidium iodide was used to counter stain nuclei, and the images were overlaid to determine both TS and pSRC localization within the cell. Confocal series images were taken on an inverted Zeiss LSM510 microscope equipped with a Plan-Apochromat 63X/1.4 oil immersion Ph 3 objective (Oberkochen, Germany). Scale bars: 10 μm. (A). Basal TS and SRC genes expression was determined by means of quantitative Real Time PCR (B) and TS, SRC and pSRC protein expression was also detected using immunoblotting (C). BACT served as housekeeping control.
