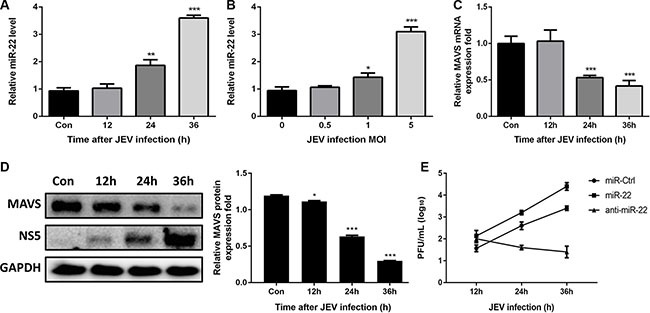
Figure 12. JEV infection upregulates miR-22 expression and downregulates MAVS expression.

(A and B) U251 cells were infected with JEV at MOI of 5 for the indicated times (A), or at indicated MOIs for 36 h (B). The levels of miR-22 were detected by quantitative real-time-PCR. (C and D) U251 cells were infected with JEV at MOI of 5 for the indicated times, and then MAVS mRNA (C) and protein (D) expression levels were determined by quantitative real-time PCR and immunoblotting, respectively. Data represent means ± SD from three independent experiments. *p < 0.05; **p < 0.01; ***p < 0.001. Protein levels were quantified with immunoblot scanning and normalized to the amount of GAPDH expression. (E) The transfected U251 cells were infected with JEV at MOI of 5. Cells were collected at the indicated time points, and titers of infectious virus in the culture supernatants were determined by plaque assay. The data represent three independent experiments with identical results.
