
Figure 1. ESE3/EHF and IL-6 expression are inversely correlated.
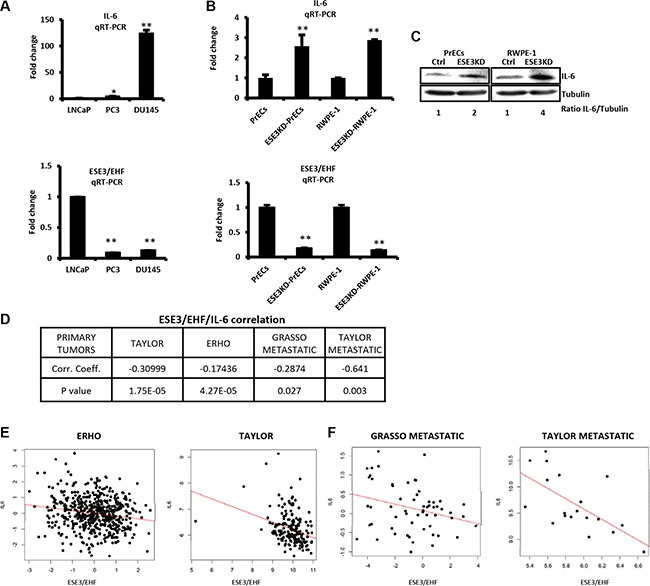
(A) IL-6 (top) and ESE3/EHF (bottom) mRNA levels evaluated by qRT-PCR in indicated PCa cell lines. β-actin was used as reference for loading control. Data are presented as fold change relative to LNCaP cells. (B) IL-6 (top) and ESE3/EHF (bottom) mRNA levels evaluated by qRT-PCR in ESE3KD cell line models. β-actin was used as reference for loading control. Data are presented as fold change relative to PrECs and RWPE-1 cells. (C) Immunoblots of IL-6 in indicated cell lines. IL-6/Tubulin ratio determined by band intensity is reported. (D) ESE3/IL-6 correlation analysis. Table shows correlation coefficient and p value in indicated datasets. (E–F). Pearson distribution plots showing significant inverse correlation between IL-6 and ESE3/EHF in human primary (E) and metastatic prostate tumors (F). P values were determined using t-test. *P < 0.05; **P < 0.01. Data are representative of three independent experiments with at least three replicates per experiment.