
Figure 2. Forest plots of HNLR versus LNLR with OS of all patients in all studies.
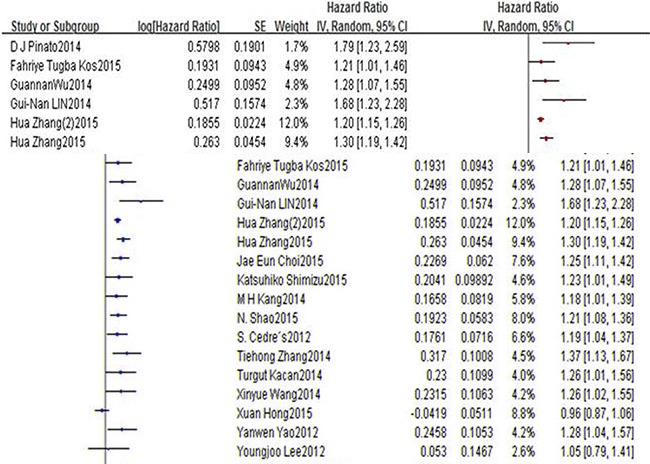
HNLR high neutrophil-to-lymphocyte ratio, LNLR low neutrophil-to-lymphocyte ratio, OS overall survival.
Official websites use .gov
A
.gov website belongs to an official
government organization in the United States.
Secure .gov websites use HTTPS
A lock (
) or https:// means you've safely
connected to the .gov website. Share sensitive
information only on official, secure websites.
HNLR high neutrophil-to-lymphocyte ratio, LNLR low neutrophil-to-lymphocyte ratio, OS overall survival.