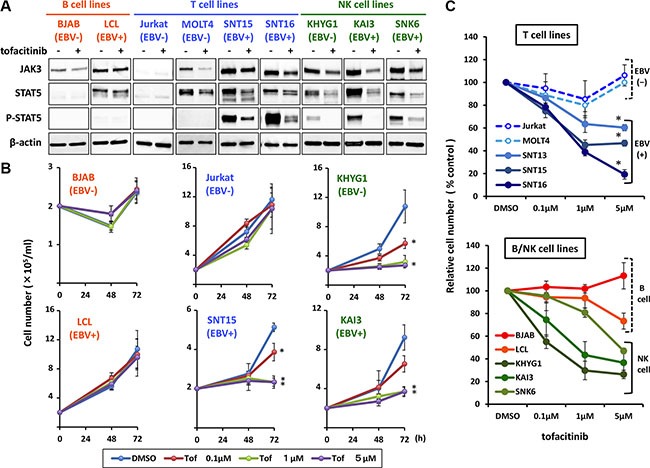
Figure 1. Effects of tofacitinib on JAK3/STAT5 pathway components and growth in B, T and NK cell lines.

(A) The following cell lines: EBV-negative B cell line (BJAB), EBV-transformed lymphoblastoid cell line (LCL), EBV-negative T cell lines (Jurkat and MOLT4), EBV-positive T cell lines (SNT15 and SNT16), EBV-negative NK cell line (KHYG1), and EBV-positive NK cell lines (KAI3 and SNK6), were treated without (−) or with (+) 1 μM tofacitinib for 24 h and cell lysates were then immunoblotted for the indicated proteins. (B) BJAB, LCL, Jurkat, SNT15, KHYG1 and KAI3 cells were treated with the indicated concentrations of tofacitinib, and viable cells were counted at the indicated times using the trypan blue exclusion test. Values are means ± SE of the results from triplicate experiments. *P < 0.05 as compared with DMSO-treated cells. (C) B, T and NK cell lines were treated with the indicated concentrations of tofacitinib for 72 h. Cell number is shown as the ratio of the cell number in the different treatment groups to DMSO-treated cells. Values are means ± SE of the results from triplicate experiments. *P < 0.05 as compared with Jurkat or MOLT4.
