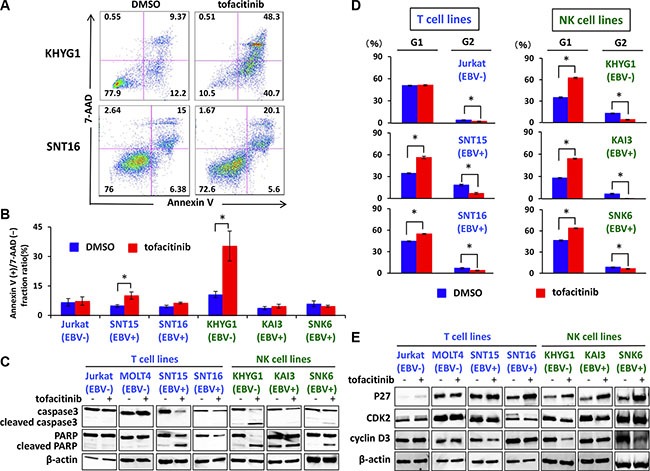
Figure 4. Effects of tofacitinib on apoptosis and cell-cycle arrest in T and NK cell lines.

(A, B) T and NK cell lines were treated with DMSO or 5 μM tofacitinib for 48 h, and apoptosis was evaluated by Annexin V-7AAD staining using flow cytometry. Values are means ± SE of the results from duplicate or triplicate experiments. *P < 0.05 as compared with DMSO-treated cells. (C) T and NK cell lines were treated with 5 μM tofacitinib for 48 h, and cell lysates were immunoblotted for caspase-3 and PARP. (D) T and NK cell lines were treated with DMSO or 5 μM tofacitinib for 24 h, following which they were fixed and stained with propidium iodide. Cell cycle profiles were assessed using flow cytometry. Values are means ± SE of the results from triplicate experiments. *P < 0.05 as compared with DMSO-treated cells. (E) T and NK cell lines were treated with 5 μM tofacitinib for 24 h and cell lysates were immunoblotted for the indicated proteins.
