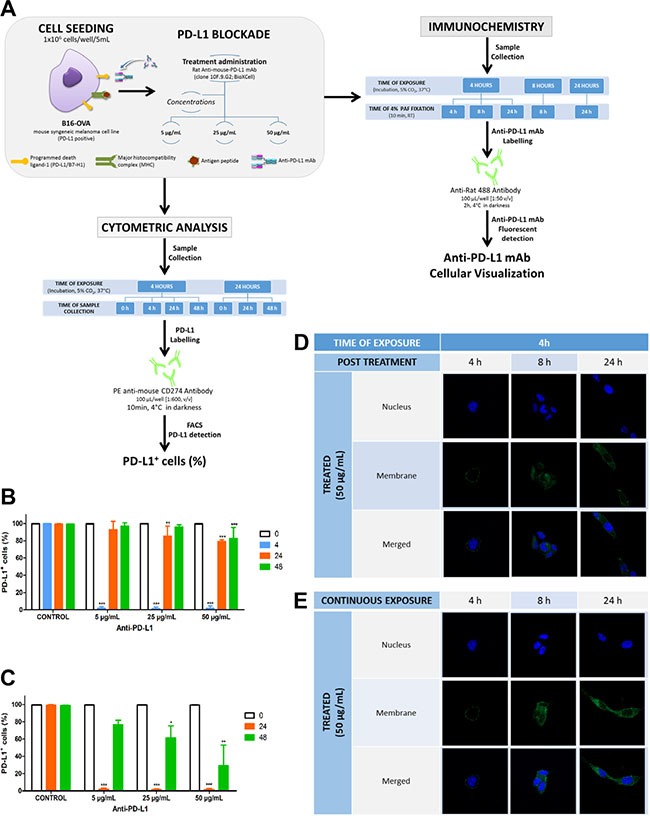
Figure 1. Effect of different anti-PD-L1 concentrations on PD-L1 availability and cells imaged by confocal microscopy to visualize complex localization.

(A) In-vitro design: Cells seeded at density of 1 × 10⁶ cells/well and exposure for 4 or 24 h at 5, 25 and 50 μg/mL of anti-PD-L were analysed by flow cytometer to quantify the PD-L1 availability over 48 h; at the same time, cells treated with 50 μg/mL for different times of exposure were fixed, stained and analyzed by con-focal microscopy. (B and C) represent the percentage of cells expressing PD-L1 over 48 h in control and after 4 h and 24 h exposure to three different antibody concentrations. Statistical differences were calculated between control and treatments and across times for each treatment (***p < 0.001; **p < 0.01; *p > 0.5). Data represent the mean ± SD of three independent experiments. (D and E) Immunohistochemical images show the location of PD-L1/ mAb in culture cells (green). Cells, incubated with 50 μg/mL anti-PD-L1 mAb at 37°C, were fluorescently labeled with mAb against anti-PD-L1 and with dapi for nuclei; upper panels correspond to cells treated for 4 h and visualized just after treatment, 4 h, and during 24 h post-treatment (panels D), and cells exposed continuously to the treatment for 24 h (panels E).
