
Figure 2. Pharmacodynamic of anti-PD-L1 administered to tumor bearing mice.
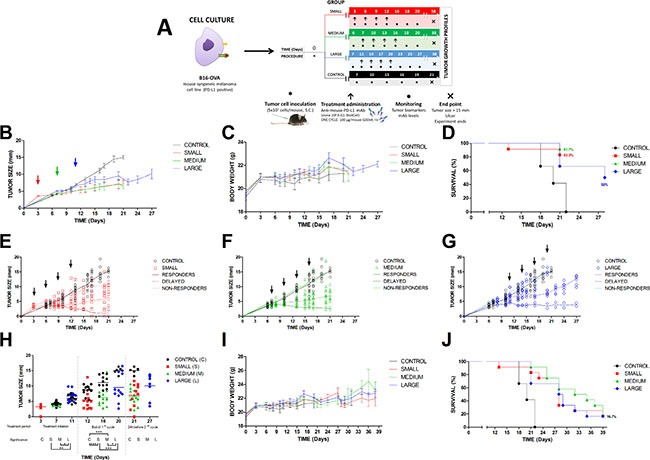
(A) experimental design for one cycle of treatment. Data are represented for control and treated groups according to different stages of the disease, small, medium and large tumor size; (B) Time profile of the mean tumor growth. Arrows show the starting time of the treatment at day 3, 7 and 11, respectively; (C) Time profile of the mean body weight; (D) Kaplan-Meier curve representing the results from the first cycle of treatment; (E–G) individual tumor growth kinetics. Symbols represent observations, solid lines mean tendency of control (black), responders and non-responders (different colours) and coloured dashed lines animals with a delayed effect. Arrows show the four doses corresponding to first cycle; (H) Individual tumor size represented by circles for control and treated groups (small, medium and large) just at the day of first and fourth dose administration and 24 h before starting the second cycle of treatment. Statistical differences were calculated across groups (*P < 0.05; **P < 0.01; ***P < 0.001). Overall data for the two cycles of treatment are shown in panels: (I) time profile of the mean body weight, and (J) Kaplan-Meier curve for the complete study.