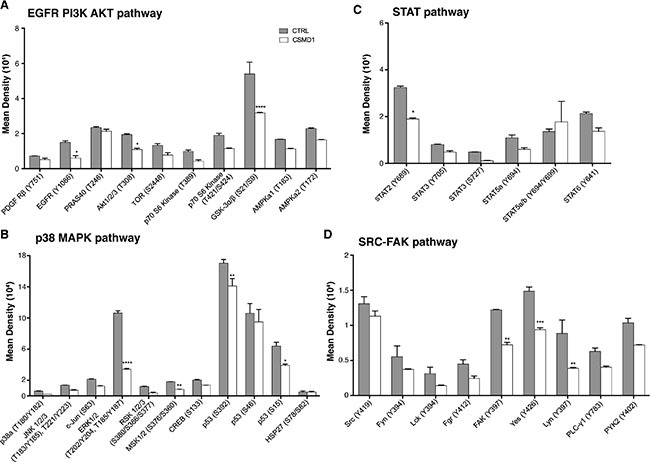
Figure 6. Analysis of phosphorylation of main kinases.

CTRL and CSMD1 expressing MDA-MB-231 cells were lysed and phosphorylation of panel of kinases was evaluated using Proteome Profiler Array (Phospho-kinase Array Kit). Quantification of mean spot pixel densities obtained for CTRL and CSMD1 cells was depicted in the plots categorized in different pathways (A) EGFR PI3K AKT (B) p38 MAPK (C) STAT (D) SRC-FAK pathway. A one-way ANOVA was used to calculate statistical significance between the CTRL cells and CSMD1 cells; *p < 0.05; **p < 0.01; ***p < 0.001.
