
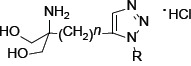
Table 1. Selected examples for the structure-activity-relationship of 1,2,3-triazole compounds.
 | ||||
|---|---|---|---|---|
| n | R | PC-3 (IC50, μM) | DU-145 (IC50, μM) | |
| SPS-1 | 1 | C6H13 | >10 | >10 |
| SPS-2 | 1 | C8H17 | >10 | >10 |
| SPS-3 | 1 | C10H21 | >10 | 9.7 |
| SPS-4 | 1 | C12H25 | >10 | >10 |
| SPS-5 | 1 | C14H29 | 4.9 | 4.7 |
| SPS-6 | 1 | C16H33 | 3.3 | 5.3 |
| SPS-7 | 1 | C18H37 | 3.0 | 4.6 |
| SPS-8 | 1 | C20H41 | 3.8 | 6.2 |
| SPS-9 | 2 | C16H33 | 6.2 | nd |
| SPS-10 | 2 | C14H29 | >10 | nd |
| SPS-11 | 3 | C14H29 | 4.2 | 5.4 |
| SPS-12 | 4 | C13H27 | 9.0 | 6.6 |
| SPS-13 | 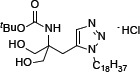 |
>10 | >10 | |
| SPS-14 | 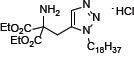 |
7.9 | > 10 | |
| SPS-15 | 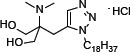 |
> 10 | > 10 | |
| SPS-16 | 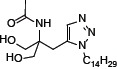 |
> 10 | > 10 | |
| SPS-17 | 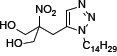 |
> 10 | > 10 | |
Cells were incubated in the absence or presence of the compound 48 hours. The cell proliferation was determined using sulforhodamine B assay.