
Figure 5. Effect of GSK-3β inhibition on the expression, phosphorylation, subcellular localization and co-transcriptional activity of β-catenin in osteosarcoma and osteoblast cells.
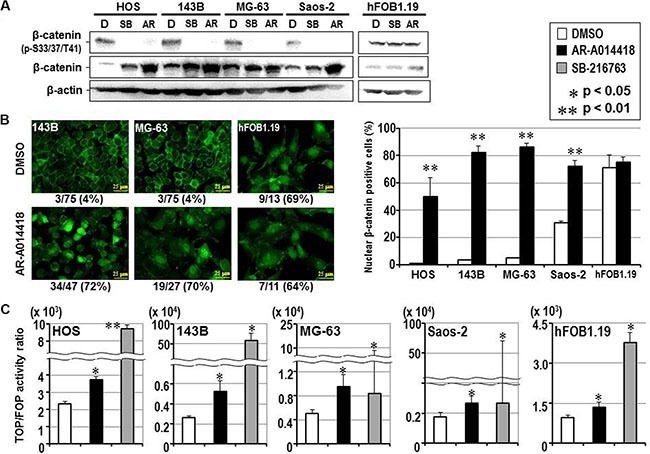
(A) Western-blotting analysis was used to compare the expression and phosphorylation of β-catenin between cells treated with DMSO and either GSK-3β inhibitor. Expression of β-actin was monitored as a loading control. (B) The left panels show representative immunofluorescence microscopic findings of expression and subcellular localization of β-catenin in osteosarcoma (143B, MG-63) and osteoblast (hFOB1.19) cells. The scale bar in each panel indicates 25 μm. The number shown below each panel indicates the percentage of nuclear β-catenin-positive cells among the total number of cells. The bar graphs on the right shows the effects of DMSO and AR-A014418 on the incidence of nuclear localization of β-catenin in osteosarcoma and osteoblast cells. In each assay, the mean percentage of nuclear β-catenin-positive cells in 3 microscopic fields was evaluated with standard deviation. (C) Relative co-transcriptional activity of β-catenin was measured by the TOP/FOP flash assay and compared between cells treated with DMSO, AR-A014418 and SB-216763, respectively. (B, C) Asterisks denote a statistically-significant difference between the data after administration of vehicle and GSK-3β inhibitors.