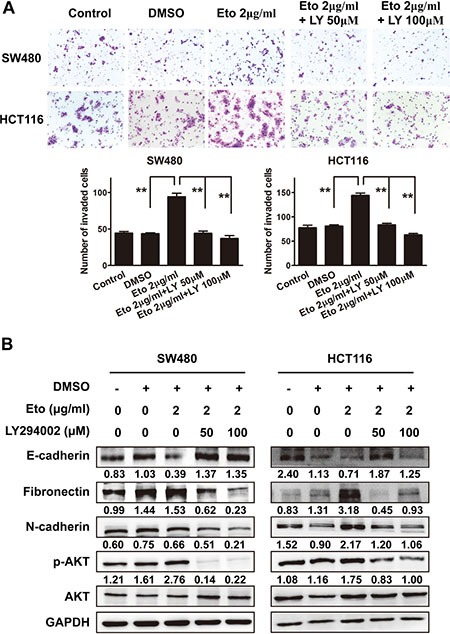
Figure 5. AKT activation is responsible for the promotive effect of etomidate on cell migration.

(A) Representative figures and data of transwell assay for indicated cells. Each bar represented the mean ± SD. The results were reproduced in three independent experiments. The asterisk (*) indicates P < 0.05. The asterisk (**) indicates P < 0.01. (B) Western blotting analysis of EMT markers and phosphorylated AKT in indicated cells. Representative figures were shown. The results were reproduced in 3 independent experiments.
