
Figure 4. Forest plots for meta-analysis of in subgroups by race in the correlation of Se level in with HCC risk.
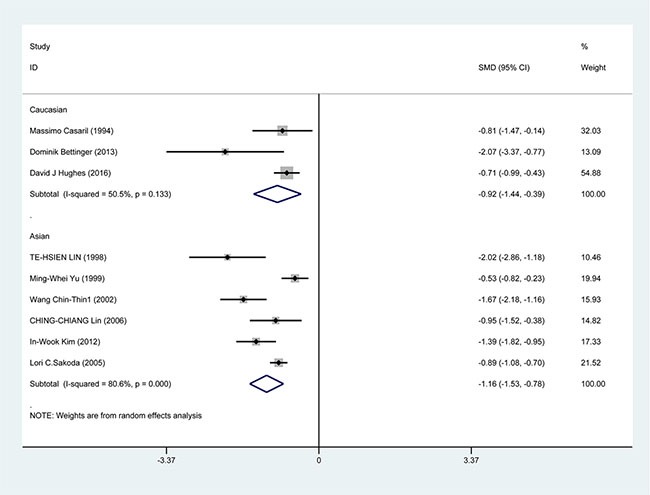
Square represents effect estimate of individual studies with their 95% confidence intervals. In this chart, studies are stored in order of years of publication and author's names, based on a random effects model.