
Figure 4. miRNA profiling and qRT-PCR validation.
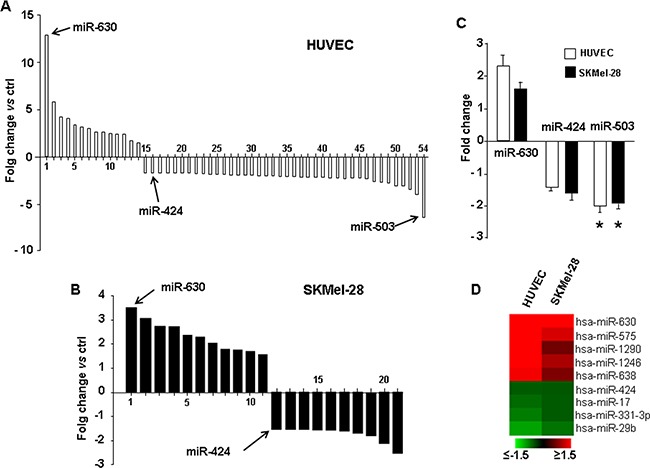
miRNome profiling in HUVEC A. and SKMel-28 cells B. overexpressin PDGFR-alpha vs Ad.null control cells. The complete list of all differentially expressed miRNAs is reported in Supplementary Table S3 and Supplementary Table S4, along with the exact fold changes and computed p values. C. qRT-PCR validation, in HUVEC and SKMel-28 cells overexpressing PDGFR-alpha. Data are reported as mean ± SD of 3 independent experiments. D. Heatmap depicting all common differentially regulated miRNAs in HUVEC and SKMel-28 over-expressing PDGFR-alpha as compared to Ad.null infected cells.