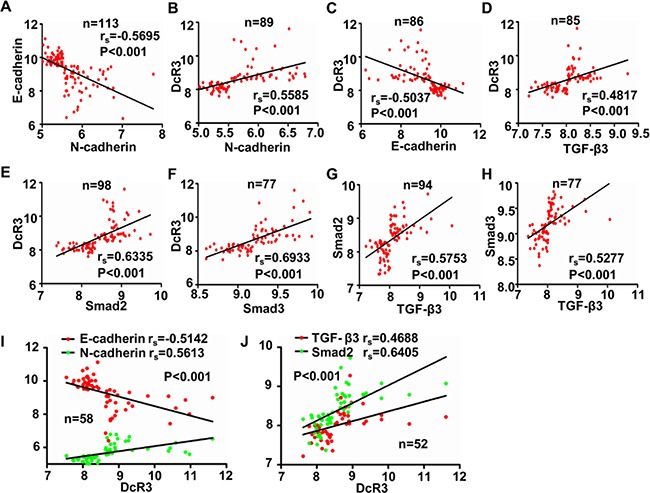
Figure 6. DcR3 was positively correlated with EMT and TGF-β3/SMAD pathway activity in CRC tissues.

A-J. Analysis of the correlations between N-cadherin and E-cadherin expression (A, rs=−0.5695, P<0.001), DcR3 and N-cadherin expression(B, rs=−0.5585, P<0.001), DcR3 and E-cadherin expression (C, rs=−0.5037, P<0.001), DcR3 and TGF-β3 expression (D, rs=0.4817, P<0.001), DcR3 and smad2 expression(E, rs=0.6335, P<0.001), DcR3 and smad3 expression(F, rs=0.6933, P<0.001), TGF-β3 and smad2 expression(G, rs=−0.5753, P<0.001), and TGF-β3 and smad3 expression(H, rs=−0.5277, P<0.001). High DcR3 expression was positively correlated with elevated expression of N-cadherin, TGF-β3, smad2, and smad3, and decreased expression of E-cadherin in human CRC tissues.
