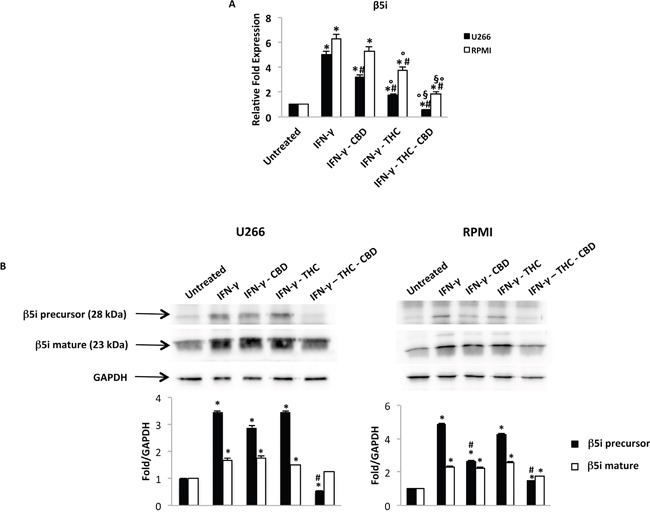
Figure 6. Regulation of the β5i subunit by THC and CBD in MM cell lines stimulated with IFN-γ.

U266 and RPMI cells were treated with IFN-γ 100 U/ml for 24 h. Then cells were treated with THC (12.5 μM), CBD (12.5 μM) alone and in combination for additional 24 h. A. The β5i mRNA levels were determined by qRT-PCR. GAPDH was used for normalization. Data are expressed as relative fold with respect to vehicle treated cells used as the control. Data are expressed as mean ± SD. *p<0.01 vs untreated; #p<0.01 vs IFN-γ; °p<0.01 vs IFN-γ-CBD; §p<0.05 vs IFN-γ-THC. B. The levels of the precursor and mature form of the β5i subunit were analysed by western blot. GAPDH was used as the loading control. Blots are representative of three separate experiments. Bars represent the densitometric analysis. *p<0.05 vs untreated cells; #p<0.05 vs IFN-γ treated cells.
