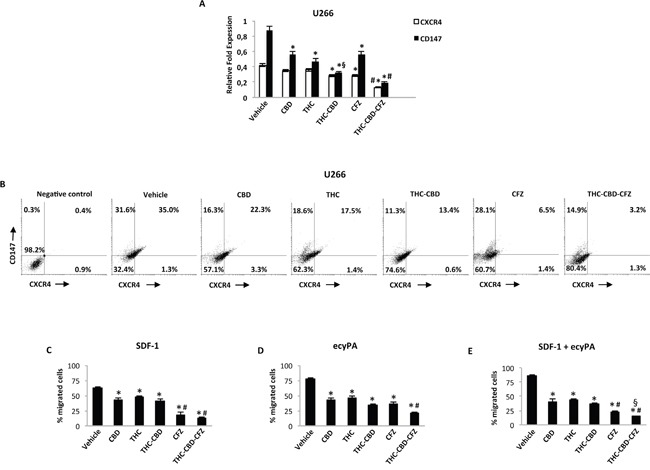
Figure 8. THC, CBD and CFZ inhibit cell migration in U266 cell line.

A. U266 cells were treated with CBD 12.5 μM, THC 12.5 μM, CFZ 100 nM alone or in combination for 24 h. CXCR4 and CD147 mRNA levels were determined by qRT-PCR. GAPDH was used for normalization. Data are expressed as relative fold with respect to vehicle treated cells used as control. Data are expressed as mean ± SD. *p<0.01 vs vehicle; #p<0.01 vs THC, CBD, CFZ alone and CBD-THC;§p<0.05 vs CBD, THC. B. CXCR4 and CD147 expression was analyzed by fow cytometry on U266 cell line treated as described above. Representative dot plots illustrate the double fluorescence. Numbers represent the percentage of cells in each quadrant. Data are representative of 1 of 4 independent experiments. C-E. Cell migration was analysed by transwell migration assays. Data represent the percentage of migrated U266 cells and are expressed as mean ± SD. In C: *p<0.01 vs vehicle; #p<0.01 vs THC, CBD, CBD-THC. In D: *p<0.01 vs vehicle; #p<0.01 vs THC, CBD, THC-CBD, CFZ. In E: *p<0.01 vs vehicle; #p<0.01 vs THC, CBD, THC-CBD; §p<0.01 vs CFZ.
