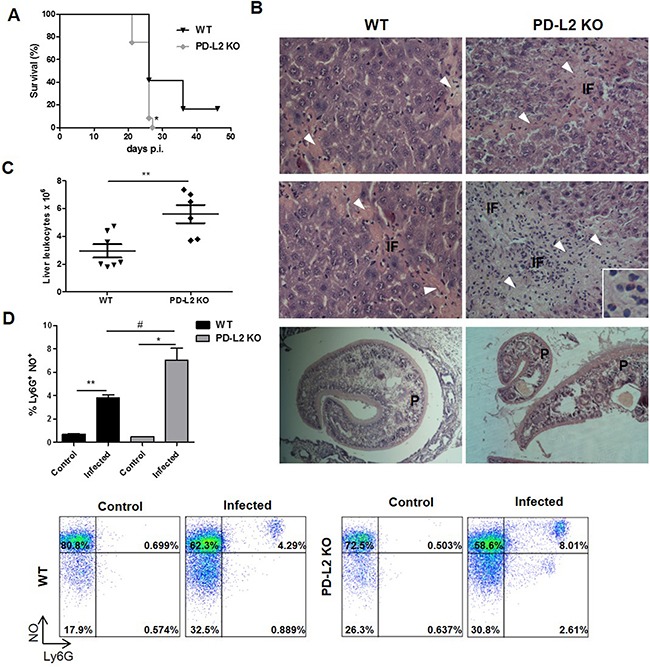
Figure 2. Increased susceptibility to F. hepatica infection in PD-L2 KO mice.

WT and PD-L2 KO mice were orally infected with 8 F. hepatica metacercariae. A. Survival was followed for 50 days, *p<0.02, Gehan–Breslow Wilcoxon test, n=12 per group. B. Representative hematoxylin and eosin images of livers from each group are shown (400x). Arrow heads in fibrosis areas, inflammatory foci (IF) and the presence of worms (P) are indicated. Inset shows the extensive inflammatory infiltrate. C. Intrahepatic leukocytes were isolated by percoll gradient and quantified in a Neubauer chamber. Each dot represents the total liver leukocyte number in individual livers of each group p=0.0065. D. Intrahepatic leukocytes were stained with anti-Ly6G before being incubated with 20μM of DAF-FMDA probe for intracellular NO detection. Bars show the percentage of Ly6G+NO+ cells. Representative dot plots of each group of control or infected WT and PD-L2 mice are shown,**p= 0.021; * p=0.0149; # p=0.0354. The data are representative of two experiments with similar results, and are expressed as mean ± SD.
