


Figure 2.
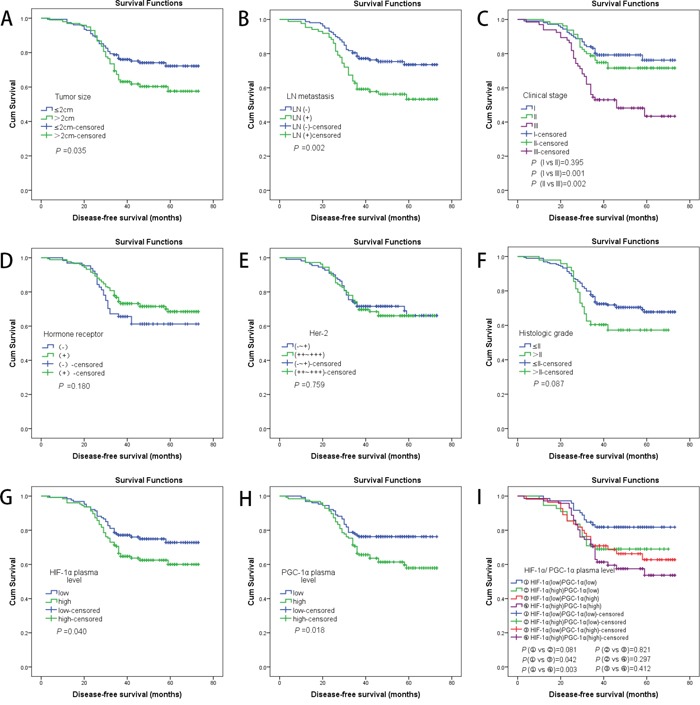
A. Kaplan–Meier analyses of the effect tumor size on DFS (P =0.035, log-rank test); B. Kaplan-Meier analyses of the effect LN metastasis on DFS (P =0.002, log-rank test); C. Kaplan-Meier analyses of the effect clinical stage on DFS (log-rank test shows difference of DFS only presence in the stage III group and the other groups); D. Kaplan-Meier analyses of the effect hormone receptor on DFS (P =0.180, log-rank test); E. Kaplan-Meier analyses of the effect HER-2 on DFS (P =0.759, log-rank test); F. Kaplan-Meier analyses of the effect histologic grade on DFS (P =0.087, log-rank test); G. Kaplan-Meier analyses of the effect HIF-1α plasma level on DFS (P =0.040, log-rank test); H. Kaplan-Meier analyses of the effect PGC-1α plasma level on DFS (P =0.018, log-rank test); I. Kaplan-Meier analyses of the effect HIF-1α and PGC-1α plasma level on DFS (log-rank test shows difference of DFS only presence in the group ① and the groups ③/④);