
Figure 3. Comparison of progression free survival in control and propranolol treated MT/Ret mice with prior primary tumor.
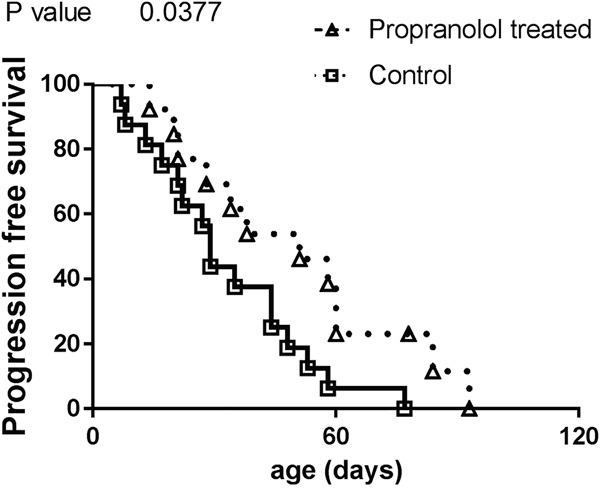
Kaplan Meyer survival curves comparing the delay between primary tumor and first metastasis appearance (i.e. progression free survival) in control (open squares) and treated animals (open triangles).