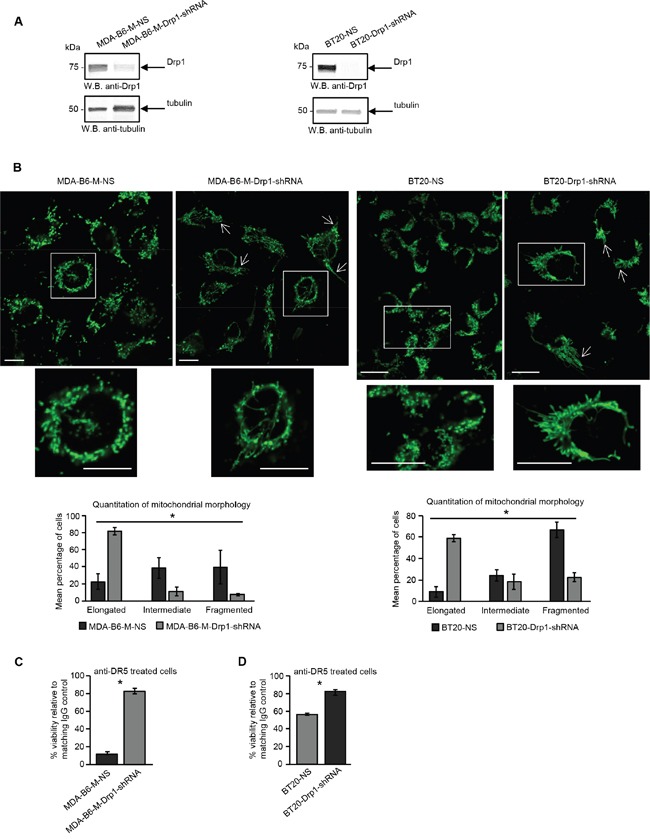
Figure 6. EPHB6 relies on DRP1 for its pro-apoptotic action.

A. MDA-B6-M and BT-20 cells were stably transduced with DRP1-targeting shRNA (MDA-B6-M-DRP1-shRNA and BT20-DRP1-shRNA) or non-silencing shRNA (MDA-B6-M-NS and BT20-NS) and DRP1 expression was examined by Western blotting. B. Mitochondria were visualised in the indicated cells by confocal microscopy as in Figure 2A. Arrows indicate elongated mitochondria. Selected areas are shown at higher magnifications. Z-stack frames were split and fluorescence intensity was adjusted using the Fiji software. Scale bar, 20 μm. Mitochondrial morphology was quantified as in Figure 2A. Each graph represents three independent experiments. C. Anti-DR5 or control IgG (10 μg/mL each) were immobilised overnight at 4°C onto 96 well plates. MDA-B6-M-DRP1-shRNA and MDA-B6-M-NS cells were loaded onto the pre-coated plates (3 x10⁴ cells/well), incubated for 24 h, and cell survival was monitored by resazurin staining. D. Anti-DR5 and control IgG were immobilised overnight onto 96-well plates at 20 μg/mL each. Cells (15,000/well) were seeded onto the pre-coated plates and incubated for 36 h. Cell survival was assessed by the MTT assay. The graphs in (C) and (D) represent cell viability as percentages relative to matching IgG controls. Each graph represents the analysis of quadruplicates. All experiments were performed at least three times. * p<0.05, Student's t-test.
