
Figure 3. PA-MSHA-induced changes in cellular ultrastructure.
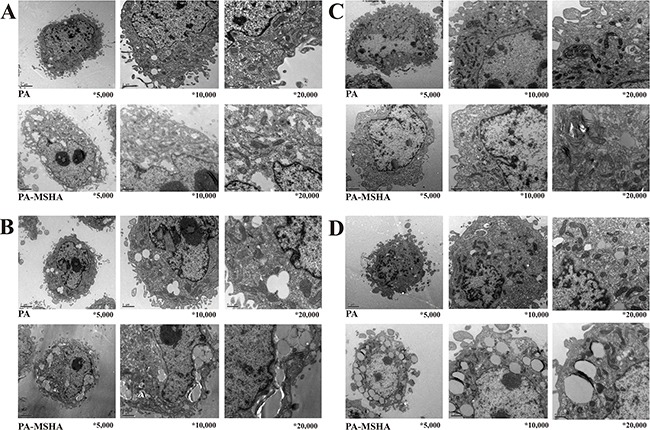
Changes in PANC-1 cell ultrastructure after treatment with PA-MSHA (10 × 108/mL) for 24 h A. and 48 h B. visualized by electron microscopy (×5,000), (x10,000), and (x20,000). Changes in SW1990 cell ultrastructure after treatment with PA-MSHA (10 × 108/mL) for 24 h C. and 48 h D. visualized by electron microscopy (×5,000), (x10,000), and (x20,000).