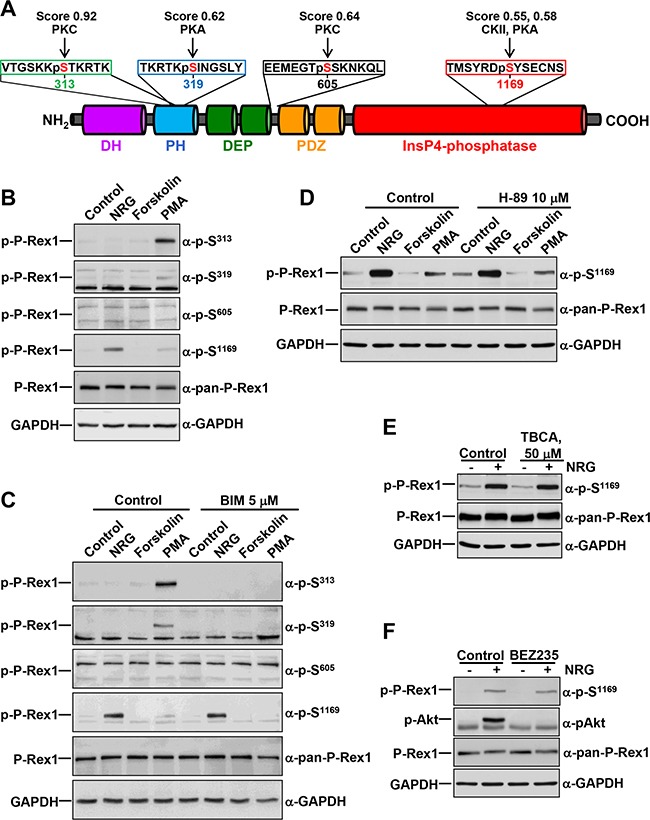
Figure 1. Regulation of P-Rex1 phosphorylation sites by different stimuli.

A. Schematic representation of the different domains of P-Rex1 depicting four regulatory phosphorylation sites, and the peptides recognized by the anti-phospho-P-Rex1 antibodies. The scores and the kinases that could potentially target the different sites recognized by those antibodies are shown. B. MCF7 cells were treated with NRG (10 nM), Forskolin (10 μM) or PMA (1 μM) for 15 minutes and lysed. P-Rex1 phosphorylation in serines 313, 319, 605 and 1169 were analyzed by Western blot with anti-phospho-specific antibodies. GAPDH was used as loading control. C. MCF7 cells were pretreated with BIM (5 μM) for 1 hour and then treated with NRG, Forskolin or PMA for 15 minutes. Cell lysates were analyzed by Western blot with the indicated antibodies. D. MCF7 cells were pretreated with H-89 (10 μM) for 30 minutes and then treated with NRG, Forskolin or PMA for 15 minutes. P-Rex1 phosphorylated at S1169 and total P-Rex1 were analyzed by Western blot. GAPDH was used as loading control. E. MCF7 cells were pretreated with TBCA (50 μM) for 3 hours and then treated with or without NRG. P-Rex1 phosphorylated at S1169 and total P-Rex1 were analyzed as described above. F. MCF7 cells were pretreated with BEZ235 (500 nM) for 1 hour and then treated with or without NRG. Cell lysates were analyzed by Western blot with the indicated antibodies. The blots shown come from an experiment that was repeated at least twice.
