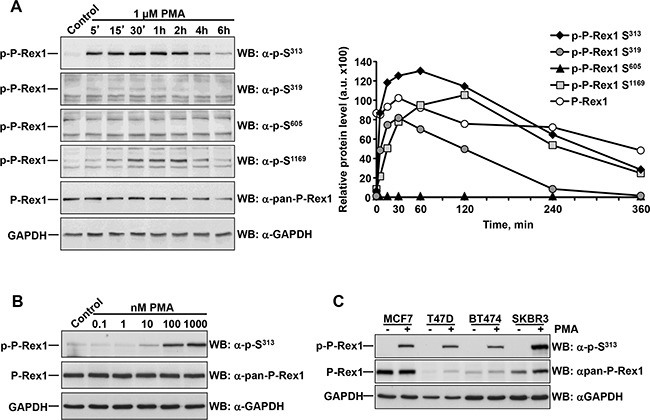
Figure 2. Dose-response and time-course of the effect of PMA on P-Rex1 phosphorylation.

A. MCF7 cells were treated with PMA for the times indicated and lysed. P-Rex1 phosphorylated at S313, S319, S605, S1169, total P-Rex1 and GAPDH expression were analyzed by Western blot, and the levels of phosphorylated and total P-Rex1 quantitated and plotted. The graph represents the relative protein levels of total and phosphorylated P-Rex1 with respect to the GAPDH levels. B. MCF7 cells treated with the indicated doses of PMA were lysed and the levels of P-Rex1 pS313 and total P-Rex1 analyzed by Western. C. MCF7, T47D, BT474 and SKBR3 cells were treated with PMA for 15 minutes and lysed. P-Rex1 pS313, total P-Rex1 and GAPDH expression were analyzed by Western blot. The blots shown come from an experiment that was repeated at least twice.
