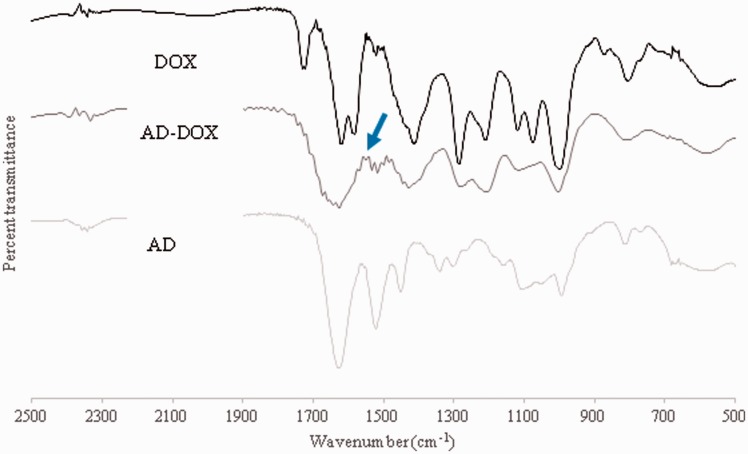
Figure 3.
FTIR spectrum confirms the drug modification. Spectra were obtained from AD, DOX, and AD-DOX from 500 to 4000 cm−1. The peak at 1560–1570 cm−1 on the AD-DOX spectrum indicates the C = N (hydrazone) bond that was formed during the synthesis of AD-DOX and that is not on either the AD or DOX spectra. Arrow on figure signifies the location of the hydrazone bond associated peak. (A color version of this figure is available in the online journal.)
DOX: doxorubicin; AD: adamantane; AD-DOX: adamantane-modified doxorubicin

