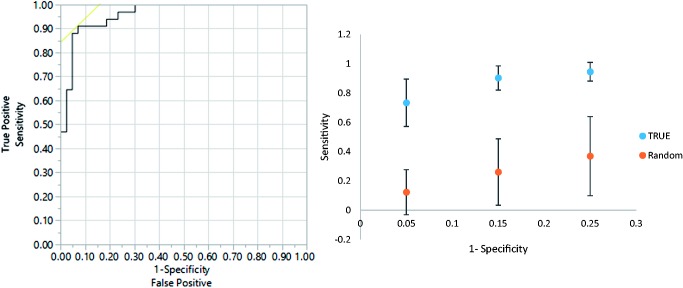
Figure 4.
ROC (upper panel) and MCCV (lower panel) using p < 0.005 in comparison of MetS group versus Obese non-MetS, metabolites and clinical characteristics (plasma glucose, plasma TG, HDL) combined model. AUROC = 0.96, sensitivity = 0.91, specificity = 0.93. True: true class model; random: random permutation model. (A color version of this figure is available in the online journal.)

