Fig. 1.

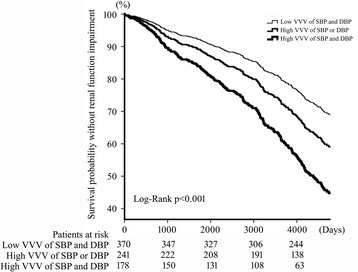
Kaplan-Meier plot of renal function impairment in newly diagnosed type II diabetic patients for 10-year follow-up. Patients was grouped into low VVV of SBP and DBP, high VVV of SBP or DBP, and high VVV of SBP and DBP

Kaplan-Meier plot of renal function impairment in newly diagnosed type II diabetic patients for 10-year follow-up. Patients was grouped into low VVV of SBP and DBP, high VVV of SBP or DBP, and high VVV of SBP and DBP