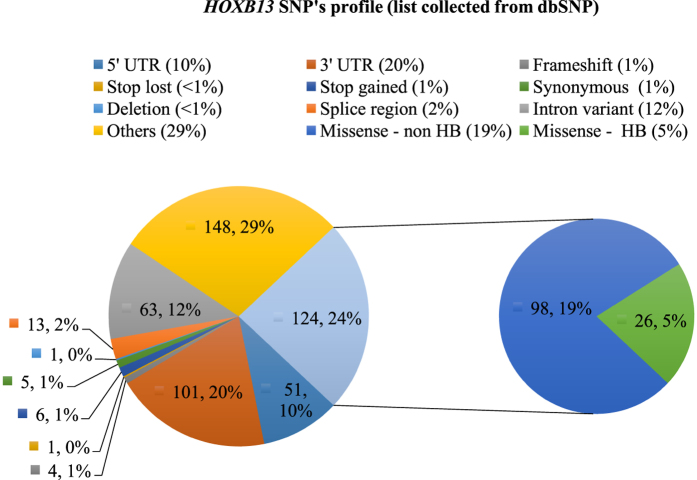
Figure 3. A statistical representation of the distribution of SNPs in the HOXB13 gene.
Distribution of SNPs in the HOXB13 gene with insight into the homeobox (HB) and non-homeobox (non-HB) region missense SNPs (info collected from dbSNP database). The numerical figures (ex. 148, 63, 101) denote the no. of SNPs as recorded in the dbSNP database, whereas, the % (ex. 29%, 20%, 12%) represents the corresponding percent of the SNP variation among the overall SNPs.

