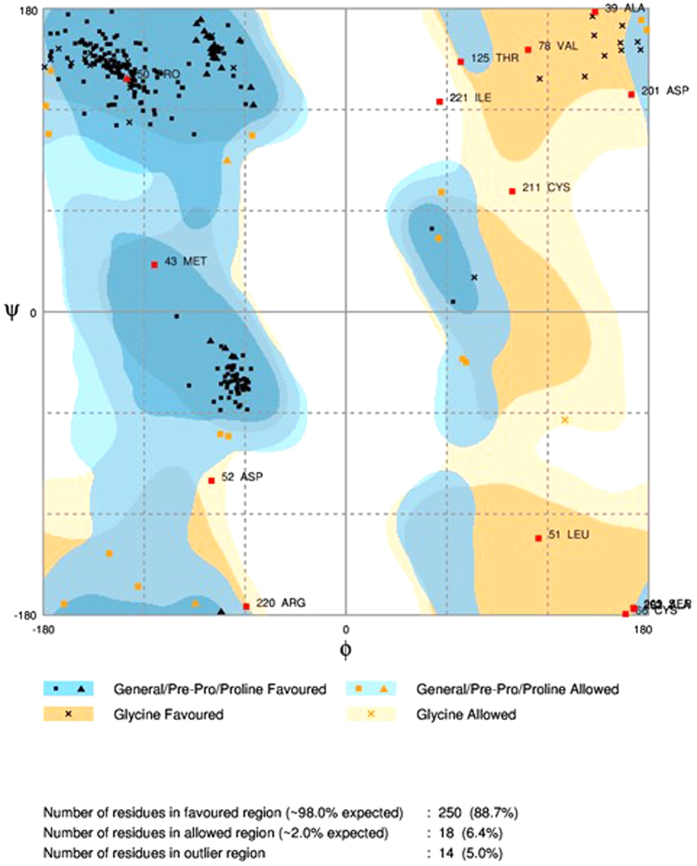
Figure 5. Ramachandran Plot for the generated protein model “hoxb13.B99990026.pdb”.
Almost 89% of the amino acid residues in the modelled protein “hoxb13.B99990026.pdb” occupied the favored region, 6% of the residues occupied the allowed region, and the remaining 5% of the residues occupied the outlier region, respectively.

