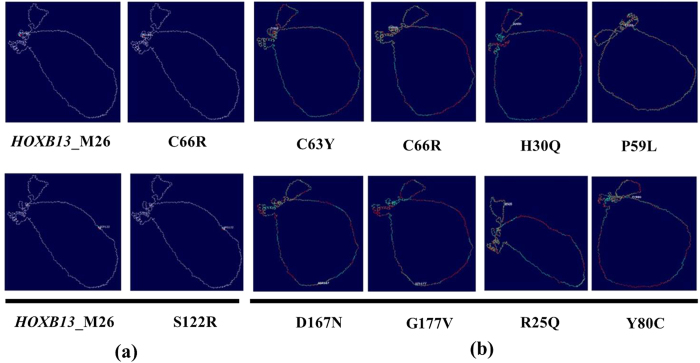
Figure 7. Electron Cloud densities and RMSD value calculation of the mutant proteins.
(a) Figure depicting the electron cloud density difference between the native protein structure and the mutants C66R and S122R. The images were modelled using SwissPDBViewer. (b) Superimposed native (HOXB13_M26) and mutant protein structures C63Y (1.80 Å), C66R (1.68 Å), D167N (1.69 Å), G177V (1.56 Å), H30Q (2.02 Å), P59L (1.80 Å), R25Q (1.52 Å) and Y80C (1.23 Å). The RMSD values and the image were modelled using SwissPDBViewer.

