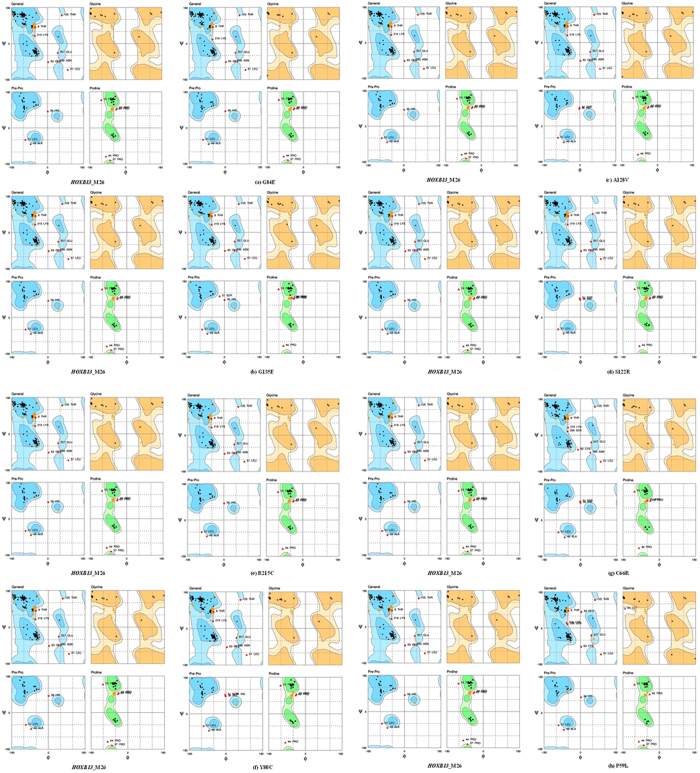
Figure 8. The Ramachandran plot for the native (HOXB13_M26) & mutant (HOXB13_M26 Mutant) protein.
Each panel contains the general plot and the plots for Glycine and Proline residues. The native protein (HOXB13_M26) showed 217 (77.2%), 49 (17.4%) and 15 (5.3%) residues in the favored, allowed and outlier region, respectively (a–c) Ramachandran Plot for the mutants G84E (220, 46, 15 residues), G135E (222, 43, 16 residues), A128V (219, 47, 1 residues) respectively, showed an increased and stable amino acid residue pattern compared to the native structure. (d) The mutant S122R (217,49, 15 residues) showed the same pattern as that of the native structure. (e–h) The mutants R215C (216, 51, 14 residue), Y80C (220, 45, 16 residues), C66R (222, 43, 16 residues) and P59L (217, 48, 16 residues) showed a highly destabilizing and damaging pattern of amino acid residue distribution, respectively.

