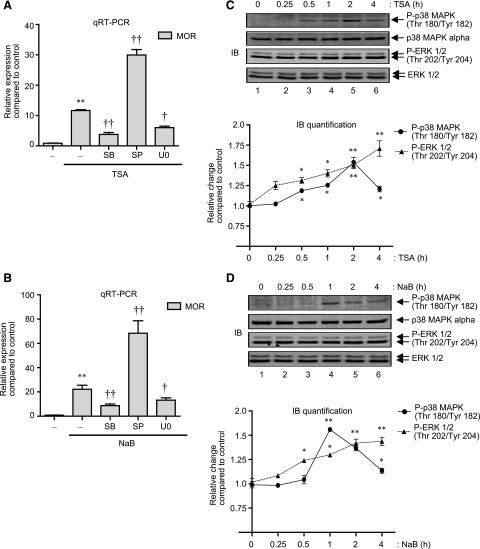
Fig. 2.
HDAC inhibition activates p38 MAPK and ERK 1/2 to regulate MOR mRNA expression. (A) P19 cells were pretreated for 1 hour with 25 μM SB (p38 MAPK inhibitor), 25 μM SP (JNK inhibitor), or 10 μM U0 (MEK/ERK inhibitor) and then treated for 8 hours with 25 ng/ml of TSA. Total RNA was extracted, reverse transcribed, and analyzed by qRT-PCR to determine changes in MOR expression levels. Results were normalized using the levels of β-actin as internal control [F(4, 15) = 167.8, **P < 0.01 versus control; †P < 0.05, ††P < 0.01 versus TSA stimulation]. (B) P19 cells were pretreated for 1 hour with SB, SP, or U0 as in (A) and then treated for 8 hours with 5 mM NaB. Total RNA was extracted, and changes in MOR expression levels were determined as explained above [F(4, 14) = 74.07, *P < 0.01 versus control; †P < 0.05, ††P < 0.01 versus NaB stimulation]. (C) Gel image: P19 cells were treated with 25 ng/ml of TSA for various lengths of time as indicated (0–4 hours), and total cell lysates were analyzed by immunoblotting with anti-phospho-p38 MAPK, anti-p38 MAPK-α, anti-phospho-ERK 1/2, and anti-ERK 1/2 antibodies. Graph: The pixel densities obtained for phospho-p38 MAPK and phospho-ERK 1/2 were normalized against the pixel densities obtained for p38 MAPK and ERK 1/2, respectively. Data from three independent results were combined and presented as relative change compared with nontreated control (*P < 0.05, **P < 0.01). (D) Gel image: P19 cells were treated with 5 mM NaB (0–4 hours) as indicated, and the levels of phospho-p38 MAPK, p38 MAPK, phospho-ERK 1/2, and ERK 1/2 were determined in the total cell lysates as above. Graph: The pixel densities obtained for phospho-p38 MAPK and phospho-ERK 1/2 were plotted against the pixel densities obtained for p38 MAPK and ERK 1/2, respectively, as in (C) (*P < 0.05, **P < 0.01).

