Fig. 3.
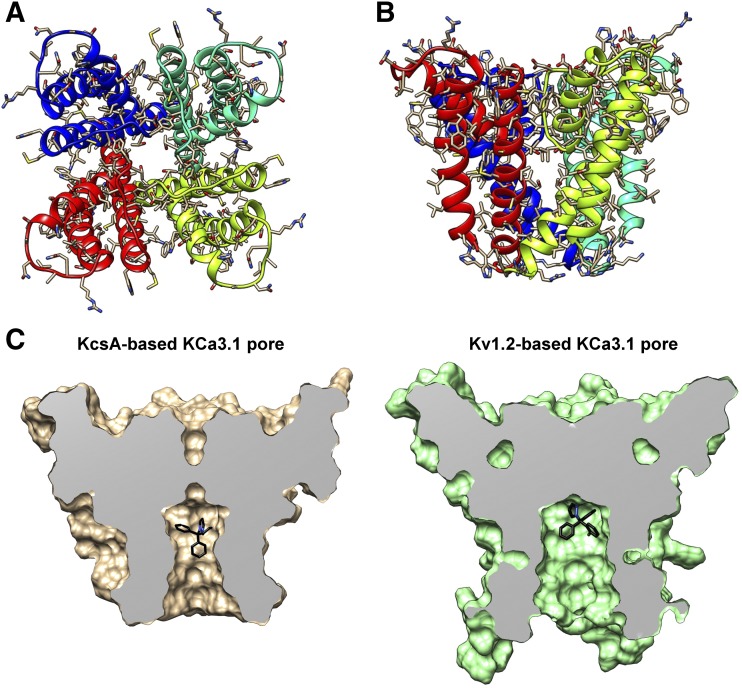
KcsA-based homology model of the KCa3.1 channel pore-forming domain and comparison of the TRAM-34 position in the KcsA- and the Kv1.2-based models. (A) View of the ribbon representation of the homology model of the KCa3.1 channel pore-forming domain from the extracellular side of the membrane. Each subunit is colored individually. (B) Transmembrane view of the model shown in (A). (C) Surface representations of the transmembrane views of TRAM-34 (black) energy minimized in the KcsA- and Kv1.2-based model. The pore has been sliced in the middle to highlight the pore lumen and fenestration regions of the structure.

