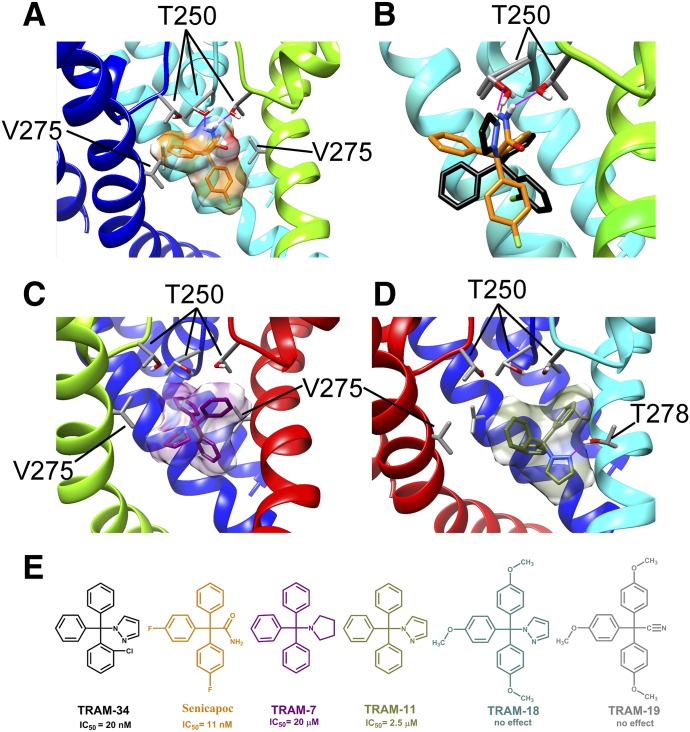
Fig. 5.
Interaction of several TRAM-34 derivatives with the KCa3.1 channel pore. (A) Transmembrane view of the ribbon representation of one of the lowest-energy models of the KCa3.1 channel complex with senicapoc. Only three subunits are shown for clarity and each subunit is colored individually. T250 and V275 side chain atoms are colored light gray (carbon), white (hydrogen), and red (oxygen). Senicapoc is shown in stick representation with a transparent molecular surface. Hydrogen bonds are shown in pink. (B) Overlay of the lowest-energy TRAM-34 (black) and senicapoc (orange) models. Hydrogen bonds between the NH2 group of senicapoc and two T250 residues are shown in pink. The hydrogen bond between one T250 residue and the pyrazole ring of TRAM-34 is shown in green. (C) Representative binding pose of 1-tritylpyrrolodine (TRAM-7) (shown in stick presentation with a transparent molecular surface). (D) One of two dominant binding poses of TRAM-11. (E) Structures of TRAM-34, senicapoc, TRAM-11, TRAM-7, 2,2,2-tris(4-methoxyphenyl)acetonitrile (TRAM-18), and 1-[tris(4-methoxyphenyl)methyl]-1H-pyrazole (TRAM-19).

