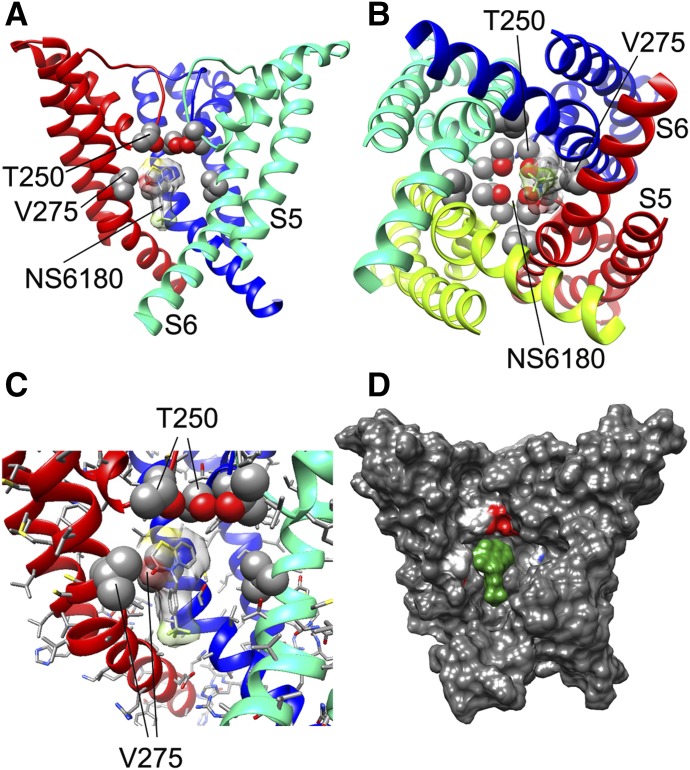
Fig. 6.
NS6180 interaction with the KCa3.1 channel pore. (A) Transmembrane view of the ribbon representation of one of the lowest-energy models of the KCa3.1 channel complex with NS6180. Only three subunits are shown for clarity and each subunit is colored individually. Side chains of T250 and V275 are shown in space-filling representation and labeled. NS6180 is shown in stick representation with a transparent molecular surface. Transmembrane segments S5 and S6 are labeled for one of the subunits. (B) Intracellular view of the model shown in (A) with all four subunits shown. (C) Close-up of the transmembrane view of the model shown in (A). (D) Surface representation of the transmembrane view of the model shown in (A). Only three subunits are shown for clarity. T250 and V275 side chain atoms are colored light gray (carbon), white (hydrogen), and red (oxygen). NS6180 is colored green.

