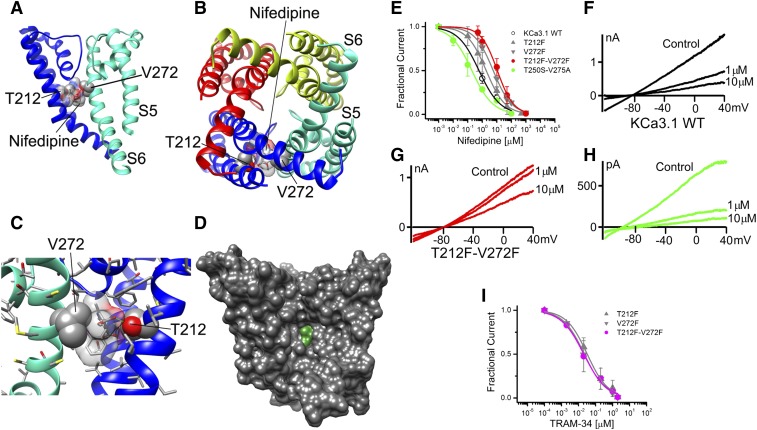
Fig. 7.
Nifedipine interaction with the KCa3.1 channel pore. (A) Transmembrane view of the ribbon representation of one of the lowest-energy models of the KCa3.1 channel complex with nifedipine. Only two adjacent subunits are shown for clarity and each subunit is colored individually. Side chains of T212 and V272 are shown in space-filling representation and labeled. Nifedipine is shown in stick representation with a transparent molecular surface. Transmembrane segments S5 and S6 are labeled for one of the subunits. (B) Intracellular view of the model shown in (A) with all four subunits shown. (C) Close-up and 90° rotated transmembrane view of the model shown in (B) with only two subunits shown. Hydrogen bonds are shown in green. (D) Surface representation of the transmembrane view of the model shown in (B). All four subunits are shown. Nifedipine is colored green. (E) Concentration-dependent inhibition of wild-type (WT) and mutant KCa3.1 channels by nifedipine. WT KCa3.1 channels are inhibited by nifedipine with an IC50 concentration of 0.74 ± 0.18 µM (h = 0.82 ± 0.28; n = 5). While the fenestration mutants T212F (IC50 = 2.70 ± 1.98 µM; h = 0.71 ± 0.14; n = 11), V272F (IC50 = 5.86 ± 2.12 µM; h = 0.75 ± 0.06; n = 4), and T212F-V272F (10.28 ± 5.18 µM; h = 1.38 ± 0.58; n = 12) decrease nifedipine block by 4-, 8-, and 14-fold, respectively, the pore double mutant T250S-V275A (IC50 = 0.16 ± 0.15 µM; h = 0.73 ± 0.26; n = 4) does not reduce the nifedipine block. (F–H), Individual current traces showing inhibition of KCa3.1 currents in the presence 1 and 10 µM nifedipine. (I) Concentration-dependent relationship of inhibition for the fenestration mutants by TRAM-34 demonstrating the lack of an effect of the fenestration mutants on the action of this pore-selective blocker: T212F (IC50 = 29.0 ± 14.5 nM; h = 0.76 ± 0.26; n = 5), V272F (IC50 = 23.0 ± 11.5 nM; h = 0.64 ± 0.13; n = 4), and T212F-V272F (IC50 = 28.5 ± 6.3 nM; h = 0.89 ± 0.11; n = 6). Data points are expressed as mean ± S.D.; n = number of independent cells used to construct the concentration-response curves.

